TL;DR
- Improved reliability. PacketVis on a mirrored multi-cloud setup.
- Surpassed 3k active organizations served.
- Reduced notifications through root-cause grouping of network events.
- Introduced automation to minimize manual intervention.
- Improved team management, and auditability with log collection.
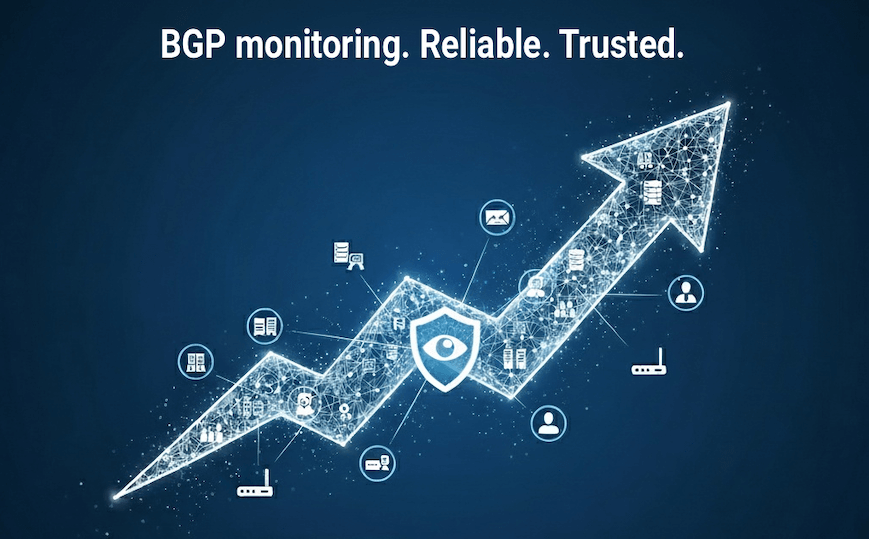
It’s been a while since our last blog post, but we haven’t been idle. In the past months, we’ve been hard at work improving the PacketVis platform and expanding its capabilities. From enriching alerts with more actionable details, to reducing notifications through root-cause grouping, and introducing bots that minimize the need for human interaction—our platform is easier to use than ever.
During this time, we also reached a major milestone: more than 3,000 organizations now use PacketVis to monitor their daily Internet operations.
From small networks to large-scale infrastructures, teams around the world rely on PacketVis to keep their BGP routing under control.
To sustain this growth and ensure consistent performance, we scaled up our architecture.
Scaling up the architecture

PacketVis multi-cloud architecture.
We increased our computational power and restructured PacketVis into a mirrored multi-cloud architecture spanning several cloud providers in different countries. Every service in the PacketVis ecosystem now runs in parallel across providers. This setup supports uninterrupted monitoring if a data center fails. Thanks to geographic distribution, PacketVis would remain operational even during large-scale incidents such as power outages.
Monitoring agents (processes performing real-time BGP analysis dedicated to an organization) can also be redundant and multi-cloud. While the overall infrastructure is mirrored, redundancy for each monitoring agent depends on the subscribed plan.

You can view your redundancy status under the "Uptime" menu.
Improved usability
We further optimized our services, particularly in terms of usability.
Starting with alert notifications, we introduced root-cause grouping: when we detect that multiple events are connected, we consolidate them and send a single notification per root cause instead of many separate ones. In other words, we reduced the strain of following up on individual alerts while still maintaining real-time notifications and keeping the full details of each event easily accessible for later review and action.

If events similar to the one you’re viewing are detected, they’ll appear in an expandable panel.
We currently send notifications for: hijacks, newly announced prefixes, loss of visibility, newly detected upstreams and downstreams, announced bogon prefixes, RPKI invalids, missing RPKI ROAs, RPKI ROA changes (diff), RPKI ROA expiry, and Trust Anchor malfunctions.
Moreover, we introduced bots to minimize manual intervention. These bots automatically keep your monitoring configuration up to date, for example, by adjusting which prefixes to monitor and their settings. The result is reduced effort and simpler housekeeping.
We also improved team management and auditability. Each organization can invite multiple team members. We added a log section under the settings menu that records and displays every operation performed by team members or by our bots.
Beyond this, many more improvements and features have been introduced across the platform.
In short, PacketVis has taken another leap forward—and we look forward to supporting you in your monitoring operations.